

Part 9 decoded digital transitions into position and direction. Every signal in that article was easy to trust once you understood it: a pin was either HIGH or LOW, full stop, and the whole job was catching those transitions in the right order. Part 10 asks what happens when the input is not simply HIGH or LOW, when a noisy ADC number has to become a trustworthy measurement before it means anything at all.
Here's the felt problem. Say you wire up a potentiometer (that's just a knob wired to report a variable voltage) to an analog pin, and you want your Arduino to act as a simple voltmeter: read the raw number, multiply it out to volts, done. Part 3 already showed you the textbook formula for that: a raw reading of 512 out of a possible 1023 should mean just about 2.5 volts, right in the middle of the Arduino's 5-volt range. So you type that formula in, upload it, and check your work against a real multimeter clipped to the same pin. The two numbers don't match. Not wildly off, but off by more than you'd expect from a rounding error, maybe a tenth of a volt or more. Your code isn't broken. The assumption baked into that formula was wrong, and it's wrong more often than most tutorials let on.
There's a second problem sitting right underneath the first one. Watch that same raw number in the Serial Monitor while you hold the knob perfectly still, and it won't sit still either. It'll drift by a count or two, second to second, for no reason you did anything to cause. That's not a bad component or a wiring mistake. It's real electrical noise, and every analog reading you'll ever take on a microcontroller carries some of it.
This part fixes both problems for good. It assumes an Uno or classic Nano; if you're on a different board, Part 2 covers what changes. By the end, you'll have built a small bench meter that reports a real, multimeter-checked voltage on one channel and a calibrated brightness percentage on another, both built from readings that have been cleaned up and checked against reality instead of trusted blindly. That's the project that proves you actually own this material, not just a gadget bolted onto the end of the article.
How Analog Measurement Really Works
What analogRead() Is Really Comparing
Think about a car's fuel gauge for a second. It doesn't tell you how many gallons are in the tank in some absolute sense. It tells you how full the tank is compared to a full tank, as a fraction, then a needle or a bar chart translates that fraction into something you can read at a glance. analogRead() works the same way. It doesn't hand your code a voltage. It hands your code a ratio, expressed as an integer from 0 to 1023, comparing the voltage on the pin you're reading to a separate value called the reference voltage, usually shortened to Vref or AREF (short for "analog reference"). On a classic Uno or Nano, that reference is the board's own 5-volt supply rail by default, the same one Part 3 introduced when it first covered analogRead() at survey level.
Written as math, it looks like this: reading = (pin voltage / reference voltage) x 1023. Flip that around and you get the formula almost every beginner tutorial teaches, including the one Part 3 used: volts = reading x (5.0 / 1023.0). That formula is only correct if the reference voltage really is exactly 5.000 volts. And here's the gotcha this article exists to name out loud: it almost never is.
A USB port doesn't guarantee a clean, exact 5 volts. Depending on the cable, the computer's own port, and whatever else is drawing power from that same USB bus, you might be feeding your Uno's regulator anywhere from about 4.8 to 5.25 volts. A 9V wall adapter through the board's onboard voltage regulator is generally steadier, but "generally steadier" still isn't "laboratory precise." Since that same rail is what analogRead() silently compares every reading against, a small error in your power supply becomes a proportional error in every single analog reading you ever take, before you've written a line of code that could be blamed for it.
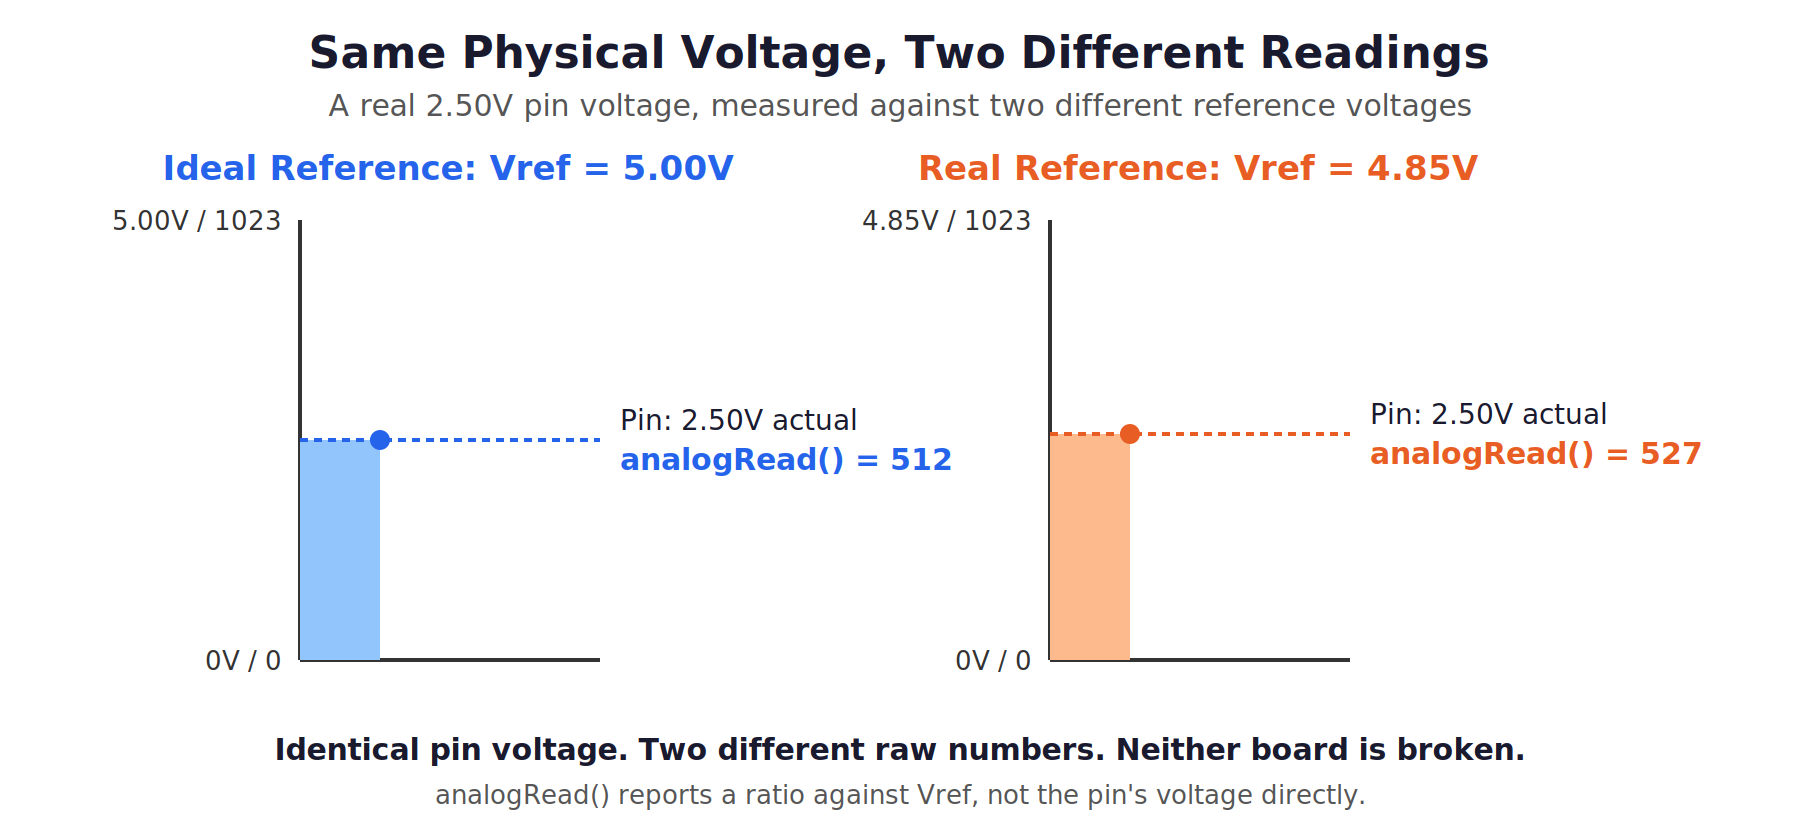
This is why two Arduino Unos, sitting side by side, reading the exact same physical voltage from the exact same bench power supply, can report two slightly different raw numbers. It's also why the same single Arduino can report a different number for the same knob position depending on whether it's plugged into a laptop's USB port or a wall charger. Neither board is broken. Neither reading is wrong, exactly. They're both accurately reporting a ratio against references that aren't quite identical to each other.
Quick heads up, the same one Part 3 flagged: you can change what "1023" means with analogReference(), pointing the ADC at a different, sometimes more stable reference voltage. That's a real, useful tool once a project truly needs it, but it adds its own wiring considerations and isn't required for anything in this article. Leave it alone for now; you don't need it to build a trustworthy measurement, because the fix this article teaches works regardless of exactly what your reference voltage happens to be.
Why the Same Reading Wobbles Every Time
Point a photoresistor at a lamp that isn't flickering, hold a potentiometer's knob so still you'd swear it can't have moved, and read the raw ADC value twice in a row anyway. You'll get two different numbers. Not wildly different, usually just a count or two apart, something like 511, then 513, then 510. That's noise: small, essentially random fluctuations layered on top of the real signal you're trying to measure.
Some of that noise comes from the physical world itself: tiny electrical interference picked up by breadboard wiring acting like a miniature antenna, or ripple riding on the power supply. Some of it comes from inside the chip. The ADC works by a method called successive approximation, essentially a fast internal guessing game that narrows in on the right answer bit by bit, and that process has its own small amount of internal switching noise. None of these sources are a defect in your particular board. They're a property of measuring small real-world voltages at all, and every analog reading you take will carry some amount of it.
One trick makes this easy to see instead of just taking it on faith: open the Arduino IDE's Serial Plotter, found under Tools, right next to the familiar Serial Monitor. Where the Serial Monitor prints numbers as scrolling text, the Serial Plotter draws whatever numbers you print as a live, moving line graph instead, no extra library required. Feed it a raw analogRead() value once per loop and you'll watch that line jitter up and down in real time, even holding the knob dead still. It's a small habit worth keeping for the rest of this series any time you want to see a signal instead of squinting at scrolling digits.
Averaging: Trading Speed for a Steadier Number
The fix for jitter is almost embarrassingly simple once you see it: take more than one reading, and average them together. If the noise on each individual sample is roughly random, some samples land a little high and some land a little low, and averaging a batch of them together cancels most of that randomness out, leaving something much closer to the real, steady value underneath.
The hard way, and the way most beginners do it without realizing there's an easier framing, is a single raw analogRead() call trusted at face value every single loop. It's fast (a single ADC conversion on an Uno takes roughly 100 microseconds) and it's exactly as noisy as the previous section described. The better way is what's usually called oversampling: taking several readings back to back in a tight loop, adding them up, and dividing by how many you took. Sixteen samples, for instance, takes only a little over a millisecond total and produces a number that holds noticeably steadier.
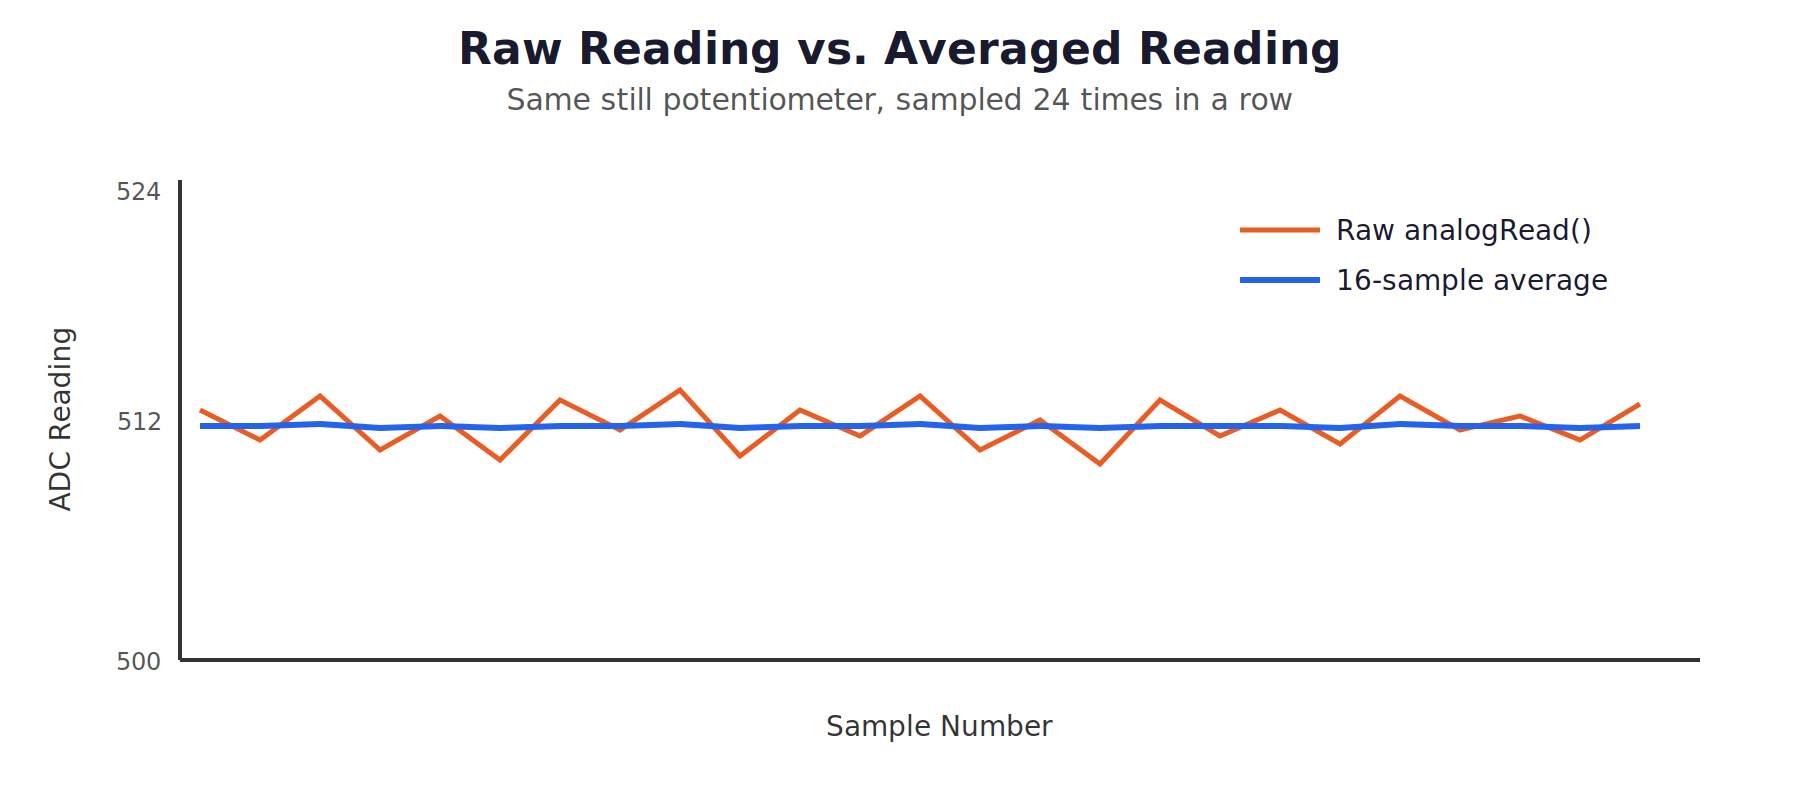
There's a real trade-off here, and it's worth naming up front rather than letting you discover it the hard way. More samples means a steadier number, but it also means it takes longer to catch up when the real value changes, since each new average still has old, no-longer-relevant samples baked into it. Sixteen samples is a reasonable starting point for a knob or a light level that changes slowly. A signal that needs to react instantly to a fast real-world change would want fewer samples, or a different smoothing approach entirely, like a rolling average that leans more heavily on recent readings. For this article's project, slow and steady is exactly what a bench meter should be, so sixteen samples is the number we'll use.
Calibration: Making the Ratio Mean Something Real
Averaging fixes noise. It does nothing at all to fix the reference-voltage problem from earlier in this section, because averaging ten slightly-wrong-in-the-same-direction readings just gives you a very steady, still slightly wrong number. To turn a ratio into a trustworthy real-world measurement, you need to check it against something that already knows the real answer, and that's exactly what a multimeter is for.
Calibration, in the sense this article means it, is the process of measuring two known real points with an independent, trusted instrument, then using the relationship between those two points to correct every future reading. This is the same underlying idea as the map() function you already used back in Part 3, just applied deliberately instead of by assumption. Instead of assuming raw 0 lines up with 0 volts and raw 1023 lines up with exactly 5.000 volts (the assumption baked into that naive textbook formula), you measure what your own actual hardware reports at two real positions with a real multimeter in hand, then draw a straight line between those two measured points and read every future value off that line.
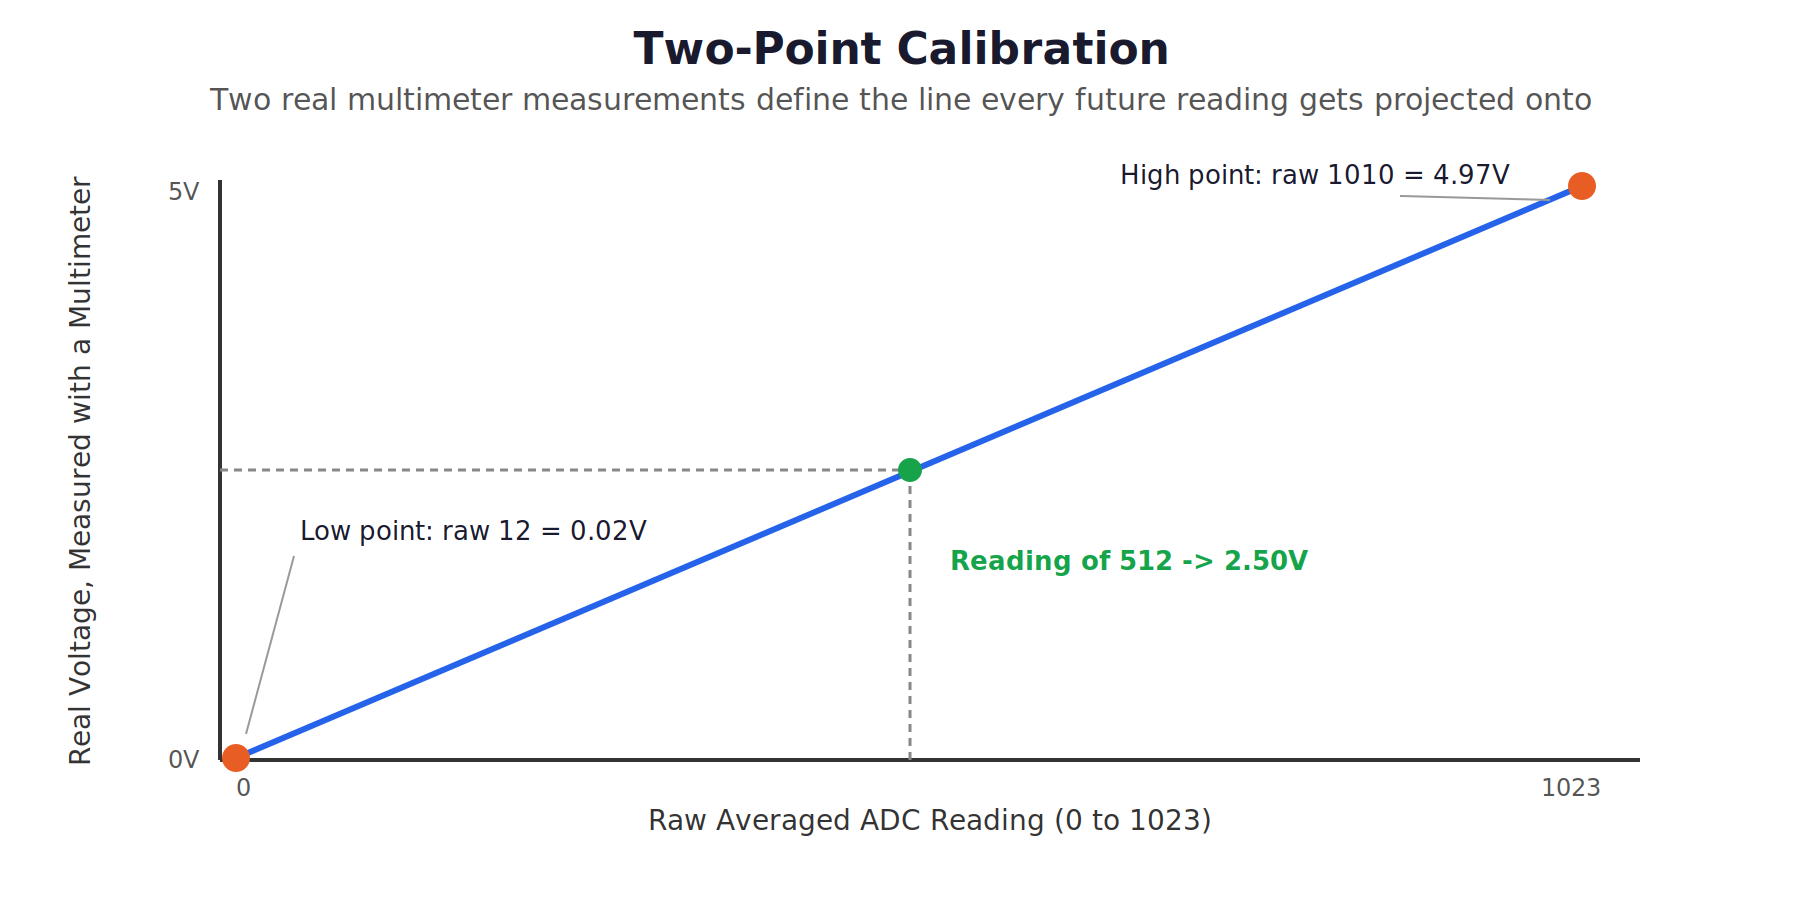
Concretely, for the potentiometer: turn the knob fully counterclockwise, note the averaged raw reading your sketch reports, and measure the actual voltage at that same position with your multimeter. Turn it fully clockwise and do the same thing again. You now have two real, trusted pairs of numbers: (raw reading, real volts) and (raw reading, real volts). Everything in between gets calculated with simple linear interpolation, the same straight-line math map() already does under the hood, just written out by hand here so you can see exactly what it's doing.
A photoresistor makes the same idea even clearer, because there's no clean "volts" answer to calibrate toward in the first place. A photoresistor's resistance doesn't correspond to a standard unit the way a potentiometer's wiper voltage does, so instead of calibrating to volts, you calibrate to a relative scale that's genuinely useful anyway: 0 percent for "as dark as this sensor and this room can produce" and 100 percent for "as bright as you're going to shine on it," with everything else falling naturally in between. That's still calibration. It's still two real, measured reference points standing in for a guess. It just proves that calibration doesn't always mean converting to an official SI unit, sometimes it means picking a reproducible, meaningful scale and anchoring it to reality.
Exercises
Bill of Materials
This covers every component used across this article's exercises and its practical project.
| Component | Description | Buy on Amazon | Buy on Temu | Buy on SparkFun | Buy on Seeed Studio |
|---|---|---|---|---|---|
| Arduino Uno | Standard microcontroller board used for every reading in this part | Amazon Link | Temu Link | SparkFun Link | Seeed Link |
| Breadboard & Jumper Wires | For prototyping every connection below | Amazon Link | Temu Link | SparkFun Link | Seeed Link |
| 10kΩ potentiometer | The "unknown voltage" this part measures, calibrates, and reports back | Amazon Link | Temu Link | SparkFun Link | Not yet available |
| Photoresistor / LDR Sensor Board | Photoresistor (LDR) sensor board with VCC, GND, DO, and AO pins; AO feeds the second, non-voltage calibration example | Amazon Link | Temu Link | Not yet available | Seeed Link |
| Resistor and LED assortment kit | Supplies the 220Ω limiter and the indicator LED itself | Amazon Link | Temu Link | SparkFun Link | Not yet available |
The products linked above may contain affiliate links. The Makers Workbench earns from qualifying purchases when these links are used.
One more thing worth having on the bench for this part specifically: a basic multimeter. It doesn't need to be expensive or fancy, a $15 model from a hardware store reads DC volts accurately enough for everything here. You can't calibrate a measurement against reality without something that already measures reality, and that's the whole point of this article.
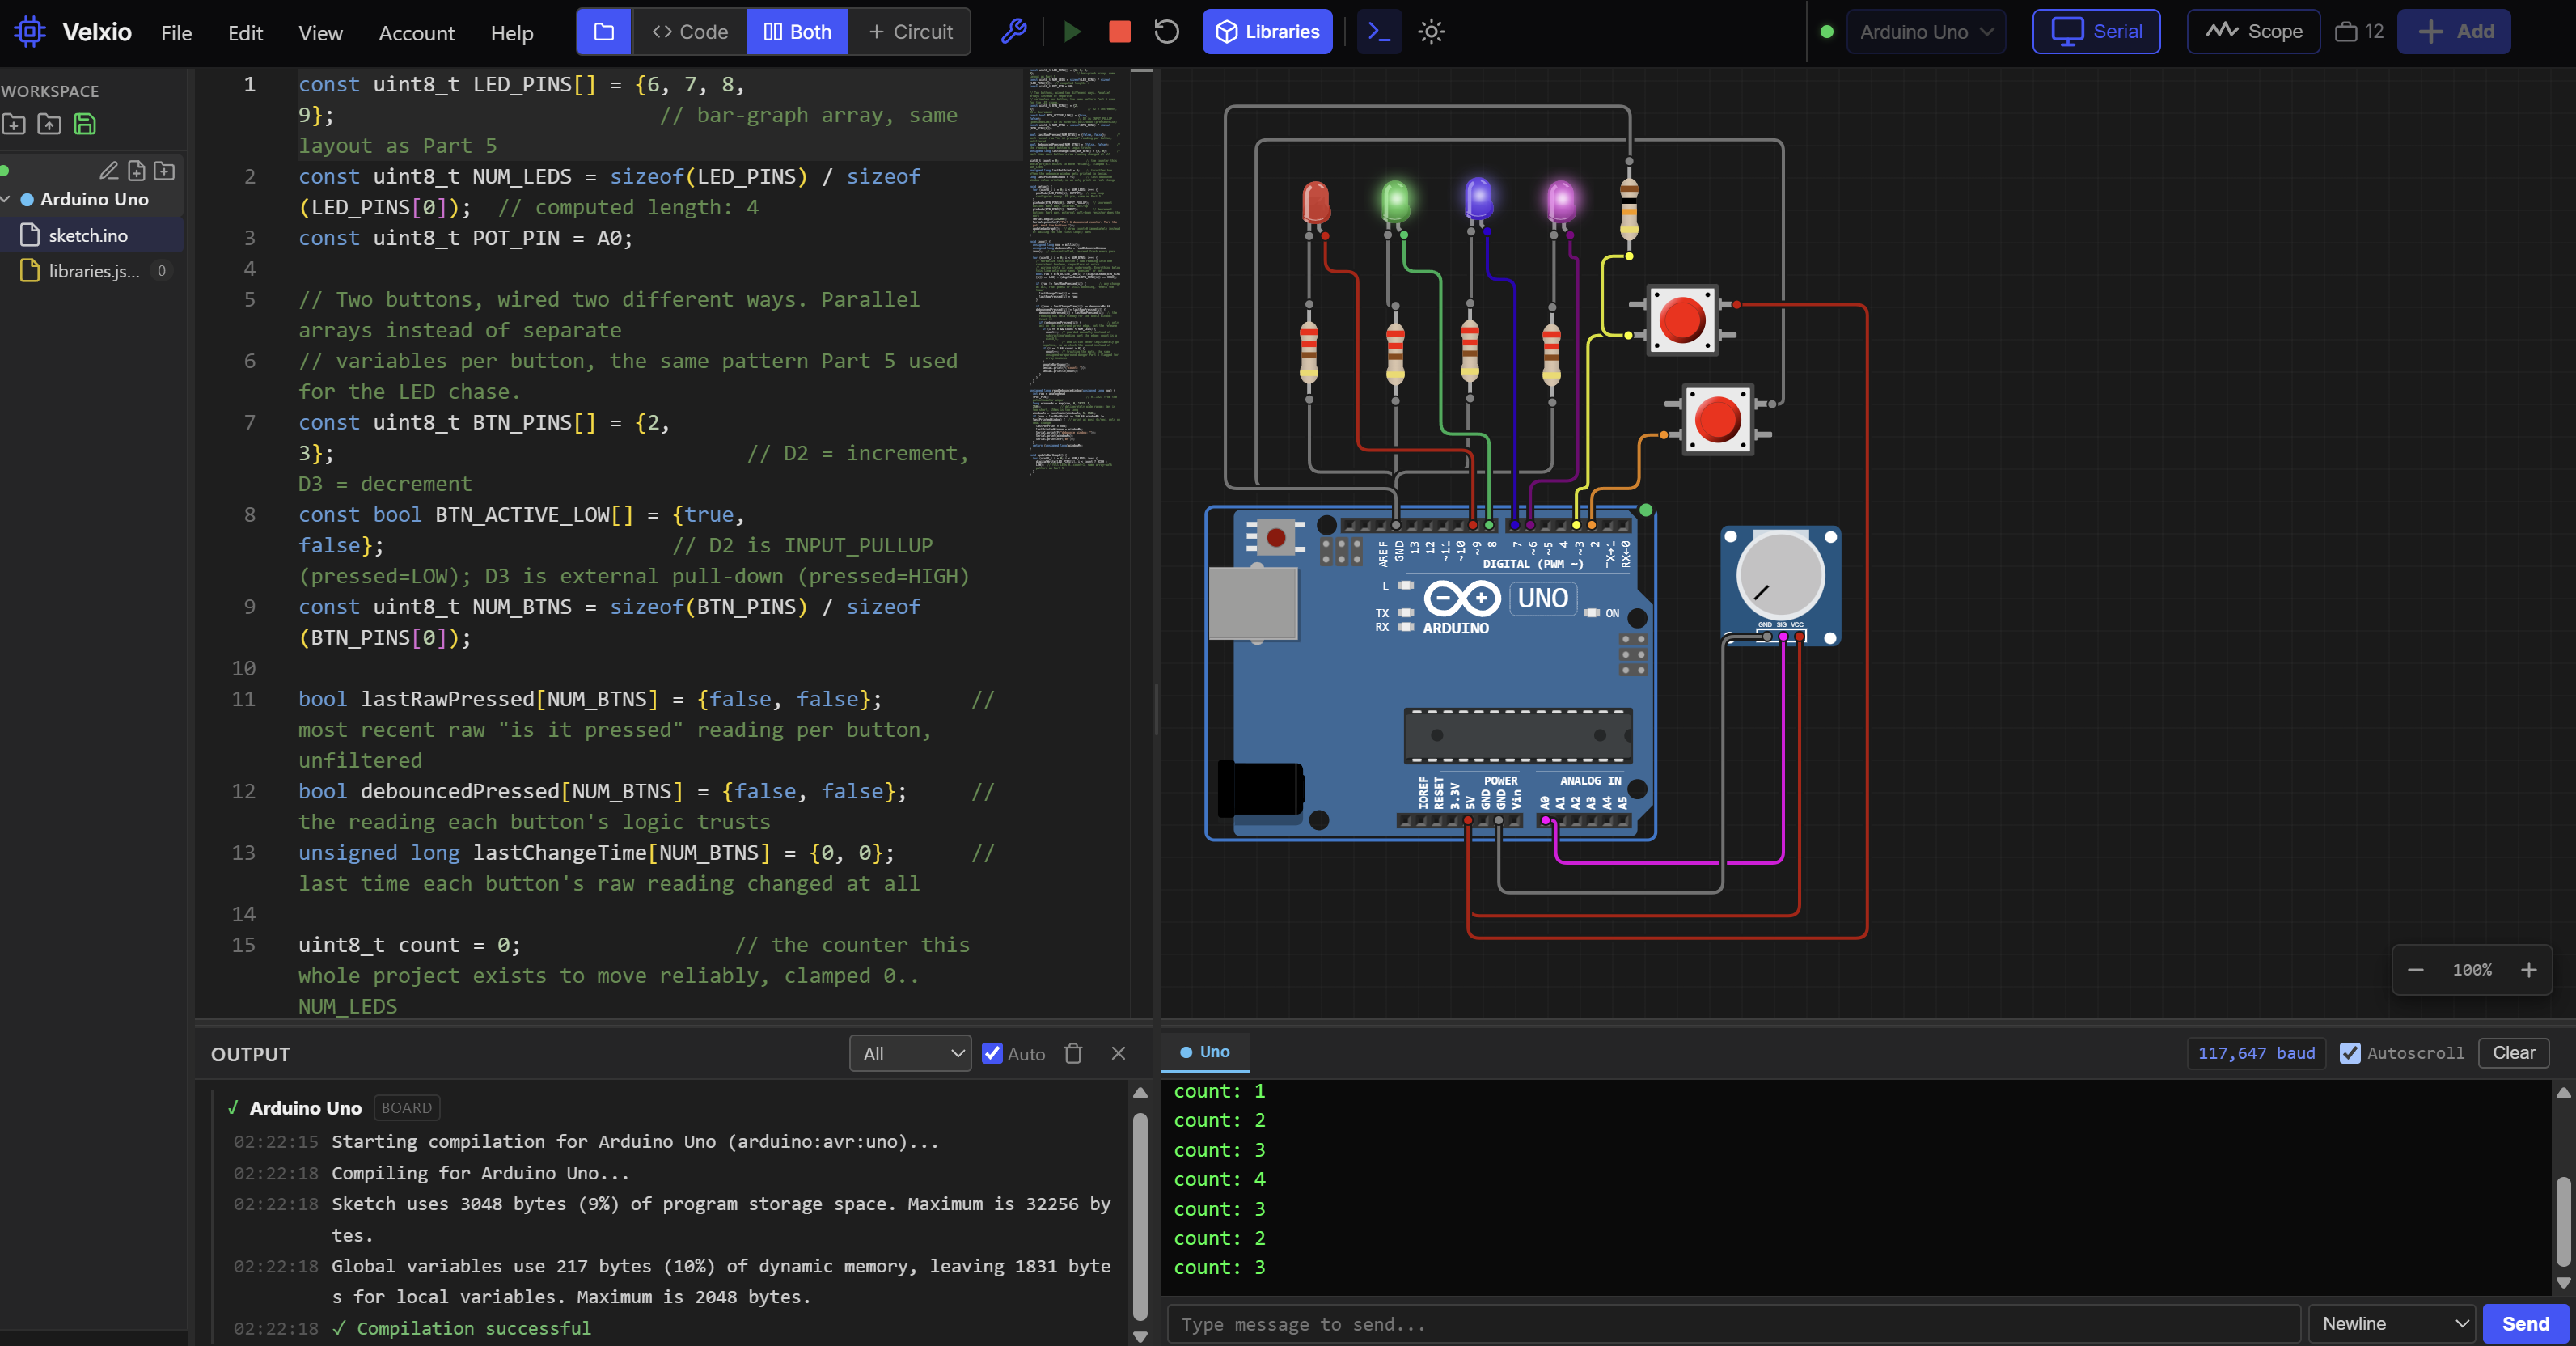
No hardware on hand? You can still build this one. Jump to the Lab embed in the practical project section below and run this whole build right in your browser.
Exercise 1: See the Number Change
- You will: Read the potentiometer's raw output and watch the printed number move as you turn the knob.
- Parts: Arduino Uno, breadboard, 10kΩ potentiometer.
- Wiring: Potentiometer's outer two pins to 5V and GND (either way round, it just flips which direction increases the reading). Center pin (the wiper) to A0.
- Sketch:
const uint8_t POT_PIN = A0;              // potentiometer wiper, our first analog input
unsigned long lastPrint = 0;
const unsigned long PRINT_INTERVAL_MS = 200;

void setup() {
  Serial.begin(115200);
}

void loop() {
  unsigned long now = millis();
  if (now - lastPrint >= PRINT_INTERVAL_MS) {
    lastPrint = now;
    int raw = analogRead(POT_PIN);             // one raw ADC reading, 0 to 1023
    Serial.println(raw);
  }
}- What to notice: Fully counterclockwise sits near 0, fully clockwise sits near 1023. Open Tools > Serial Plotter instead of the Serial Monitor and watch it as a moving line instead of scrolling text.
- If it fails: Reading stuck at 0 or 1023 with no movement at all usually means the wiper (center pin) isn't really on A0, or the potentiometer's outer legs aren't reaching both 5V and GND.
Exercise 2: Catch the Jitter
- You will: Hold the knob perfectly still and watch the raw number wobble anyway.
- Parts: Same as Exercise 1.
- Wiring: Same as Exercise 1.
- Sketch:
const uint8_t POT_PIN = A0;
unsigned long lastPrint = 0;
const unsigned long PRINT_INTERVAL_MS = 500; // slower interval, gives you time to read a whole line before the next one

void setup() {
  Serial.begin(115200);
  Serial.println(F("Hold the knob perfectly still and watch these five readings."));
}

void loop() {
  unsigned long now = millis();
  if (now - lastPrint >= PRINT_INTERVAL_MS) {
    lastPrint = now;
    for (uint8_t i = 0; i < 5; i++) {   // take five back-to-back readings of the exact same physical position
      Serial.print(analogRead(POT_PIN));
      Serial.print(F(" "));
    }
    Serial.println();
  }
}- What to notice: The five numbers on each line usually aren't identical, something like
511 512 510 511 513, even though the knob never moved. That's the noise the previous section described, happening on your own hardware, not just in theory. - If it fails: All five numbers really are identical every time, that's not a failure, some boards and power sources are simply cleaner than others. Try wiggling a jumper wire slightly or touching the breadboard rail near the wiring, real noise usually reappears.
Exercise 3: Average Away the Wobble
- You will: Replace the single raw reading with an averaged one and watch the wobble shrink.
- Parts: Same as Exercise 1.
- Wiring: Same as Exercise 1.
- Sketch:
const uint8_t POT_PIN = A0;
const uint8_t SAMPLE_COUNT = 16;  // more samples give a steadier number but a slower reading
unsigned long lastPrint = 0;
const unsigned long PRINT_INTERVAL_MS = 200;

int averagedRead(uint8_t pin) {
  long total = 0;  // long, so raising SAMPLE_COUNT past 32 can't overflow an int
  for (uint8_t i = 0; i < SAMPLE_COUNT; i++) {
    total += analogRead(pin);
  }
  return total / SAMPLE_COUNT;
}

void setup() {
  Serial.begin(115200);
}

void loop() {
  unsigned long now = millis();
  if (now - lastPrint >= PRINT_INTERVAL_MS) {
    lastPrint = now;
    int raw = analogRead(POT_PIN);           // one single, noisy reading, same as Exercise 2
    int averaged = averagedRead(POT_PIN);
    Serial.print(F("raw: "));
    Serial.print(raw);
    Serial.print(F("   averaged: "));
    Serial.println(averaged);
  }
}- What to notice: The raw column still bounces the way Exercise 2 did. The averaged column holds noticeably steadier at the same physical knob position. Try plotting both variables on the Serial Plotter at once, the visual difference is worth seeing directly.
- If it fails: Averaged value still jumps around a lot, raise
SAMPLE_COUNT(try 64). Averaged value feels sluggish to respond when you turn the knob, lowerSAMPLE_COUNTinstead. That trade-off is real, not a bug.
Exercise 4: Give the Reading Real Units
- You will: Convert the averaged reading into an estimated voltage using the textbook ratio math, compare that estimate against a real multimeter reading, then calibrate it into a number that matches instead.
- Parts: Same as Exercise 1, plus a basic multimeter set to measure DC volts.
- Wiring: Same as Exercise 1.
- Sketch:
const uint8_t POT_PIN = A0;
const uint8_t SAMPLE_COUNT = 16;
unsigned long lastPrint = 0;
const unsigned long PRINT_INTERVAL_MS = 300;

// Calibration points: turn the pot fully counterclockwise, measure the wiper voltage with
// your multimeter, and note the averaged raw value this sketch reports for that exact position.
// Repeat fully clockwise. Replace all four constants below with your own two measured pairs.
const int CAL_RAW_LOW = 12;          // averaged raw reading at the low position
const float CAL_VOLTS_LOW = 0.02;    // multimeter reading at that same position
const int CAL_RAW_HIGH = 1010;       // averaged raw reading at the high position
const float CAL_VOLTS_HIGH = 4.97;   // multimeter reading at that same position

int averagedRead(uint8_t pin) {
  long total = 0;
  for (uint8_t i = 0; i < SAMPLE_COUNT; i++) {
    total += analogRead(pin);
  }
  return total / SAMPLE_COUNT;
}

float naiveVolts(int raw) {
  return raw * (5.0 / 1023.0); // textbook math: assumes the reference is exactly 5.000V, which it usually isn't
}

float calibratedVolts(int raw) {
  // Volts represented by each single ADC count, calculated from your own two measured points.
  float slope = (CAL_VOLTS_HIGH - CAL_VOLTS_LOW) / (float)(CAL_RAW_HIGH - CAL_RAW_LOW);
  return CAL_VOLTS_LOW + slope * (raw - CAL_RAW_LOW); // project the current reading onto the line between your two real measurements
}

void setup() {
  Serial.begin(115200);
}

void loop() {
  unsigned long now = millis();
  if (now - lastPrint >= PRINT_INTERVAL_MS) {
    lastPrint = now;
    int avg = averagedRead(POT_PIN);
    Serial.print(F("naive: "));
    Serial.print(naiveVolts(avg), 3);       // 3 decimal places for a close comparison against the multimeter
    Serial.print(F(" V   calibrated: "));
    Serial.print(calibratedVolts(avg), 3);
    Serial.println(F(" V"));
  }
}- What to notice: The naive and calibrated columns disagree, usually by a small but real amount. Hold the multimeter's probes on the wiper and A0 at the same time; the calibrated column should track it noticeably closer than the naive one does.
- If it fails: Calibrated reading is way off, not just slightly, you likely swapped which measured pair is LOW and which is HIGH, or didn't re-measure after switching power sources (USB versus a wall adapter can shift your actual reference voltage enough to matter).
Exercise 5: Calibrate a Sensor That Isn't Even a Voltage
- You will: Wire in the photoresistor sensor board and calibrate its raw reading into a 0 to 100 percent relative brightness scale instead of volts.
- Parts: Photoresistor / LDR sensor board.
- Wiring: Sensor board VCC to 5V, GND to GND, and AO to A1. Leave DO unconnected.
- Sketch:
const uint8_t LDR_PIN = A1;  // AO output of the sensor board
const uint8_t SAMPLE_COUNT = 16;
unsigned long lastPrint = 0;
const unsigned long PRINT_INTERVAL_MS = 300;

// Calibration points: cover the sensor completely with your hand for the dark reading, then
// hold a bright flashlight close to it for the bright reading. Replace both with your own values.
const int CAL_RAW_DARK = 10;    // averaged reading with the sensor fully covered
const int CAL_RAW_BRIGHT = 57; // averaged reading under a bright flashlight

int averagedRead(uint8_t pin) {
  long total = 0;
  for (uint8_t i = 0; i < SAMPLE_COUNT; i++) {
    total += analogRead(pin);
  }
  return total / SAMPLE_COUNT;
}

int brightnessPercent(int raw) {
  int percent = map(raw, CAL_RAW_DARK, CAL_RAW_BRIGHT, 0, 100);  // map() scales between your two measured endpoints
  return constrain(percent, 0, 100); // clamp in case a reading falls outside the two points you recorded
}

void setup() {
  Serial.begin(115200);
}

void loop() {
  unsigned long now = millis();
  if (now - lastPrint >= PRINT_INTERVAL_MS) {
    lastPrint = now;
    int avg = averagedRead(LDR_PIN);
    Serial.print(F("Brightness: "));
    Serial.print(brightnessPercent(avg));
    Serial.println(F("%"));
  }
}- What to notice: Covering the sensor drives the percentage toward 0. A flashlight held close drives it toward 100. Normal room light should land somewhere reproducible in between, session to session. In The Lab, lower or raise the sensor’s light level instead of covering it.
- If it fails: Percentage pinned at 0 or 100 no matter what you do usually means AO is not on A1, or the dark and bright readings are too close together. If the percentage moves the wrong way (100 in the dark), your board reads higher in the dark: swap your two calibration numbers, because map() accepts a reversed range.
Practical Project: The Calibrated Bench Meter
Done looks like: The Serial Monitor shows a steady, believable voltage reading for the potentiometer that doesn't visibly jitter the way Exercise 2's raw number did, printed alongside a 0 to 100 percent brightness reading for the photoresistor. Cover the photoresistor with your hand and the indicator LED turns on within about a second. Uncover it and the LED turns back off.
What you will build
- A two-channel bench meter: a real, multimeter-checked voltage on one channel, and a relative brightness percentage on the other.
- Both readings built from averaged, noise-reduced samples, never a single raw
analogRead()call trusted at face value. - An indicator LED that reacts to a calibrated threshold you measured yourself, not to a raw ADC number that happens to look meaningful.
- All timing handled with
millis(), the same non-blocking pattern Part 4 established. Nothing here usesdelay().
Components needed
Everything is already in the Bill of Materials above: the Arduino Uno, breadboard, 10kΩ potentiometer, photoresistor sensor board, and the resistor and LED assortment kit for the 220Ω LED limiter and the LED.
Lab embed
Wiring
| Part | Arduino |
|---|---|
| Potentiometer wiper (center pin) | A0 |
| Potentiometer outer pins | 5V and GND |
| Photoresistor sensor board, VCC | 5V |
| Photoresistor sensor board, GND | GND |
| Photoresistor sensor board, AO | A1 |
| Photoresistor sensor board, DO | Not connected |
| Indicator LED anode, through 220Ω resistor | D8 |
| Indicator LED cathode | GND |
No new libraries. Every function in the sketch below is core Arduino, already covered in Part 3 or Part 4.
The sketch
// ---- pins ----
const uint8_t POT_PIN = A0;  // the "unknown voltage" this meter measures
const uint8_t LDR_PIN = A1;  // AO output of the sensor board
const uint8_t INDICATOR_LED_PIN = 8;  // lights when the room reads dark

// ---- averaging ----
const uint8_t SAMPLE_COUNT = 16;

// ---- potentiometer calibration: two real points measured with a multimeter ----
const int POT_CAL_RAW_LOW = 12;         // averaged raw reading, knob fully counterclockwise
const float POT_CAL_VOLTS_LOW = 0.02;   // what the multimeter read at that position
const int POT_CAL_RAW_HIGH = 1010;      // averaged raw reading, knob fully clockwise
const float POT_CAL_VOLTS_HIGH = 4.97;  // what the multimeter showed at that position

// ---- photoresistor calibration: dark and bright endpoints ----
const int LDR_CAL_RAW_DARK = 10;        // averaged reading with the sensor fully covered
const int LDR_CAL_RAW_BRIGHT = 57;     // averaged reading under a bright flashlight held close
const int DARK_THRESHOLD_PERCENT = 15;  // brightness below this we call "dark" and light the LED

unsigned long lastReportTime = 0;
const unsigned long REPORT_INTERVAL_MS = 250;

void setup() {
  Serial.begin(115200);                     // matches the site default baud rate
  pinMode(INDICATOR_LED_PIN, OUTPUT);
  Serial.println(F("Calibrated Bench Meter booting..."));
}

int averagedRead(uint8_t pin) {
  // Oversampling: SAMPLE_COUNT back-to-back readings, averaged together, cancels out
  // most of the random noise a single analogRead() call carries (see Exercise 3).
  long total = 0;  // long, so a larger SAMPLE_COUNT can't overflow an int
  for (uint8_t i = 0; i < SAMPLE_COUNT; i++) {
    total += analogRead(pin);
  }
  return total / SAMPLE_COUNT;
}

float calibratedVolts(int rawAveraged) {
  // Linear interpolation between the two real-world points measured with a multimeter (see Exercise 4).
  float slope = (POT_CAL_VOLTS_HIGH - POT_CAL_VOLTS_LOW) / (float)(POT_CAL_RAW_HIGH - POT_CAL_RAW_LOW); // volts per raw ADC count
  return POT_CAL_VOLTS_LOW + slope * (rawAveraged - POT_CAL_RAW_LOW); // project the current reading onto that measured line
}

int calibratedBrightnessPercent(int rawAveraged) {
  // Same two-point idea as the voltage channel, scaled to 0-100% instead (see Exercise 5).
  long percent = map(rawAveraged, LDR_CAL_RAW_DARK, LDR_CAL_RAW_BRIGHT, 0, 100);
  percent = constrain(percent, 0, 100); // clamp in case a reading falls outside the two calibration points
  return (int)percent;
}

void loop() {
  unsigned long now = millis();  // unsigned subtraction keeps working when millis() wraps (see Part 4)
  if (now - lastReportTime >= REPORT_INTERVAL_MS) {
    lastReportTime = now;

    int potRaw = averagedRead(POT_PIN);
    int ldrRaw = averagedRead(LDR_PIN);

    float volts = calibratedVolts(potRaw);
    int brightnessPercent = calibratedBrightnessPercent(ldrRaw);

    Serial.print(F("Voltage: "));
    Serial.print(volts, 2);  // two decimals is about all a 10-bit ADC can honestly support
    Serial.print(F(" V   Brightness: "));
    Serial.print(brightnessPercent);
    Serial.println(F("%"));

    bool isDark = brightnessPercent < DARK_THRESHOLD_PERCENT;
    digitalWrite(INDICATOR_LED_PIN, isDark ? HIGH : LOW);  // light only when dark by our measured scale, not a raw ADC number
  }
}
What's happening
Every quarter second, loop() wakes up (the same millis() gate Part 4 taught, still with no delay() anywhere in sight) and runs both channels through the exact pipeline the exercises built one piece at a time. averagedRead() is Exercise 3's oversampling helper, taking sixteen raw samples on each channel instead of trusting a single noisy one. calibratedVolts() is Exercise 4's multimeter-checked linear interpolation, turning the potentiometer's averaged ratio into a real voltage instead of the naive textbook guess. calibratedBrightnessPercent() is Exercise 5's version of the same idea, scaled to a 0 to 100 percent range instead of volts, since a photoresistor was never going to give you a clean SI unit anyway. The last two lines compare that calibrated brightness against DARK_THRESHOLD_PERCENT, a number you measured yourself, and drive the indicator LED accordingly.
If the project fails the "done" test
The most common culprit is leaving this article's example calibration constants in place instead of replacing all six of them with your own multimeter readings and your own dark/bright measurements. Those example numbers describe one specific potentiometer, one specific photoresistor, and one specific power source measured while writing this article, not universal constants for every Arduino ever built. The second most common culprit is a floating A1 pin, usually the sensor board's AO wire that never reached A1, or its VCC or GND left unconnected. Check both against the wiring table above before assuming the code itself is wrong.
Troubleshooting
| Symptom | Cause | Fix |
|---|---|---|
| Calibrated voltage doesn't match your multimeter at all | Calibration constants copied from this article's example values instead of your own hardware | Re-measure both calibration points on your own board and multimeter, then replace all four POT_CAL_ constants |
Reading still jitters noticeably even after switching to averagedRead() | SAMPLE_COUNT too low for a noisy breadboard or power supply | Raise SAMPLE_COUNT, for example from 16 to 64, accepting a slightly slower response to real changes |
| The same physical voltage reads differently on two Arduinos, or before and after a power source change | The reference voltage assumption changed; different boards, or the same board on a different supply, don't share an identical 5V rail | Recalibrate on that specific board and power source rather than reusing another combination's constants |
| Brightness percent stays pinned at 0% or 100% no matter the actual light level | AO is not wired to A1, or the dark and bright calibration readings were too close together | Confirm the sensor board wiring against the table above, then re-measure with a real dark cover and a real bright light (in The Lab, the lowest and highest light-level settings) |
| Indicator LED never turns on, even in near-total darkness | DARK_THRESHOLD_PERCENT set below what your room's real dark-calibrated reading is, or the LED is wired backward | Check the LED's anode and cathode orientation, and lower the threshold if your "dark" calibration point wasn't dark enough |
| A1 reads stuck near 0 or near 1023 no matter what | The sensor board is missing power or ground, or AO is not on A1 | Check VCC goes to 5V, GND goes to GND, and AO goes to A1, as the wiring table specifies |
Where This Fits in the Series
You can now explain why analogRead() hands back a ratio instead of a voltage, why that same reading wobbles even when nothing physical changed, and how to turn both of those facts into a measurement you can trust: average away the noise, then calibrate the result against something that already knows the real answer. Every analog sensor this series touches from here forward can lean on that same pattern instead of the raw-number trust Part 3's survey left unexamined.
- Part 3: Programming Arduino: Sketches, Core Functions, and Libraries, whose survey-level introduction to
analogRead()this part builds directly past - Part 4: Timing Without delay(), millis(), micros(), and Non-Blocking Loops, whose non-blocking timing pattern runs this part's entire project
If you want to see a completely different way of pulling a measurement off a sensor, the site's existing DHT22 temperature and humidity article is worth a look, but it's worth being honest about what it actually is: the DHT22 uses its own single-wire digital protocol, not the ADC this part covers, so it's a different technique solving a different kind of measurement problem, not a deeper look at analogRead() itself.
Wrap-Up and What's Next
analogRead() returns a ratio against a reference voltage, not a direct measurement of anything in real-world units, and that reference is rarely as exact as the textbook formula assumes. A single raw reading also carries genuine electrical noise, wobbling slightly even when nothing physical has changed. Averaging several samples together trades a little speed for a steadier number, and real calibration against an independent, trusted instrument like a multimeter is what actually turns that steadier ratio into a measurement you can believe.
Next up, Part 11: UART: Serial Is a Bus, where the Serial.print() calls this series has leaned on since Part 3 finally get explained as the actual communication protocol they've been the whole time.
Want to go deeper? Download the full eBook once the series is complete, and subscribe for the rest of the Arduino Mastery Series.
Hack The World and Make Awesome.