"Debug" in Arduino conversations means three different jobs. Compiler errors in the bottom pane. Serial.println as a window into a running sketch. And live debugging: pause the program on the chip, look at variables, step line by line.
Arduino IDE 2 has a debugger UI for the third job. It is the feature Arduino highlights next to autocomplete. It is also the feature that does nothing useful on a classic Uno unless you add extra hardware.
Part 7 of the Mastery Series is print debugging as a method. Part 8 is interrupts, which are extra-sensitive to breakpoints because pausing the chip changes time. This article is the IDE 2 debugger: what it needs, what a session looks like, and what it will lie about.
What live debugging needs
The microcontroller has to accept a debug probe: a SWD or similar connection (Serial Wire Debug: a two-wire debug interface on many ARM chips). Official boards with on-board debug (Arduino Zero, some SAMD and newer official boards) can talk to IDE 2's debugger. An external probe (Atmel-ICE, J-Link, and similar) can attach to boards that bring those pins out.
A classic Uno (ATmega328P) talks to your PC through a USB-serial bridge. That chip does not expose a full hardware debugger over the same cable you use for Upload. (Old-school engineers call those in-circuit emulators, or ICE, which is where the "ICE" in Atmel-ICE comes from.) You can still debug an Uno. You do it with Serial, an LED, and a method. You cannot click the gutter, press debug, and watch x update on that Uno over USB-serial alone.
If Tools has no debug probe that matches your board, stop. Do not reinstall IDE 2. You have the wrong hardware for this UI.
A session, when the board supports it
- Select the board and the debug probe in IDE 2 (the debug sidebar / Tools, depending on version).
- Click the gutter next to a line to set a breakpoint: a marker that means "pause here."
- Start debugging from the sidebar. The IDE compiles a debug build (a version compiled with fewer optimizations and extra information, so the debugger can map machine code back to your lines), uploads, and attaches.
- When execution hits that line, the editor shows variable values. Step Over runs the next line. Step Into goes into a function. Continue runs until the next breakpoint.
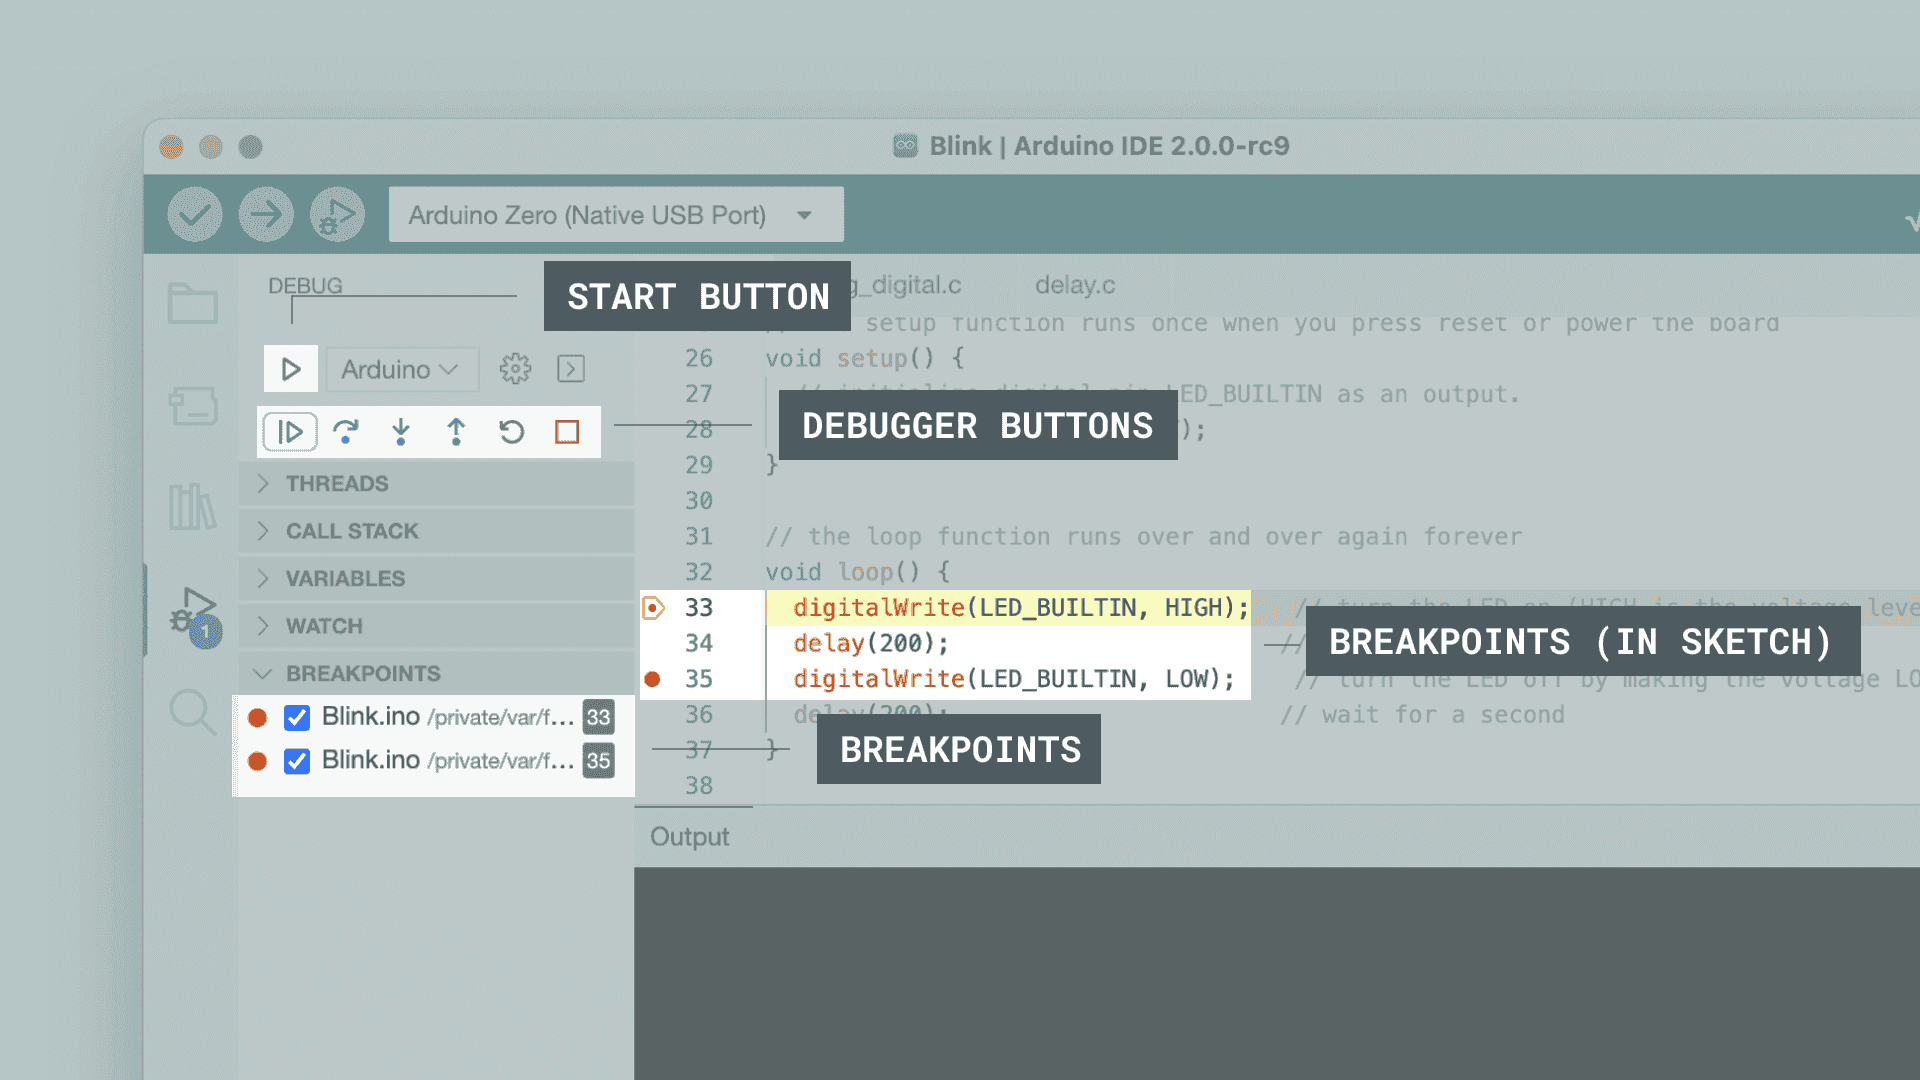
Breakpoints in loop() will hit constantly. Put one where a state changes, or on the line after you read a sensor, not on delay().
You still need a working USB (or probe) cable. Debug upload can fail for the same COM/driver reasons as a normal upload.
The Serial method on an Uno, worked through
Since most readers are on a board without a debug probe, here is the same idea done the way an Uno allows. The sketch below counts button presses and prints each event. It looks too simple to need debugging, which is exactly why it makes a good example:
const int BUTTON_PIN = 2;
bool lastPressed = false;    // Remembers the previous reading
int pressCount = 0;

void setup() {
  Serial.begin(115200);
  pinMode(BUTTON_PIN, INPUT_PULLUP);   // Internal resistor holds the pin HIGH until pressed
  // F() keeps this text in flash memory instead of scarce RAM. A boot banner
  // also proves setup() finished, which is the first question in any debug.
  Serial.println(F("boot: setup done"));
}

void loop() {
  bool pressed = (digitalRead(BUTTON_PIN) == LOW);   // Wired to GND, so LOW means pressed
  if (pressed && !lastPressed) {   // Count only the moment of change, not every loop pass
    pressCount++;
    Serial.print(F("press #"));
    Serial.println(pressCount);
  }
  lastPressed = pressed;
}
If the count jumps by two or three per press, you have just seen contact bounce (a mechanical button flickers on and off for a few milliseconds as the metal settles), and no breakpoint was needed to find it. Printing a value with a label is the habit that matters. A bare number in the Monitor means nothing in an hour.
A poor man's breakpoint
You can fake the "pause and inspect" feel with Serial alone. This helper stops the sketch until you type any character into the Serial Monitor:
// Prints where we are, then waits for you to send a character.
// It is a crude breakpoint: great for slow sketches, dangerous for motors.
void pauseHere(const char* label) {
  Serial.print(F("PAUSED at "));
  Serial.println(label);
  while (!Serial.available()) { }   // Spin until a character arrives
  Serial.read();                    // Throw it away so the next pause waits again
}
Call pauseHere("after sensor read") wherever you would have clicked the gutter. Unlike a true breakpoint it cannot show variables you did not print, and it does nothing about interrupts, but it costs no hardware. Keep it away from anything that moves, since a stalled loop leaves outputs frozen in whatever state they were in.
Reading a compiler error first
The earliest kind of debugging happens before the board is involved. When Verify fails, scroll to the first red line, because later errors are often echoes of it:
sketch.ino:14:3: error: expected ';' before '}' token
That reads as file, line 14, column 3, then the complaint. The complaint is a semicolon missing on or just above that line. Fix the first error, verify again, and many of the others vanish on their own.
Timing lies
When the chip is paused, time stops from the sketch's point of view. millis() does not advance while you stare at a variable. Hardware that needed a pulse keeps waiting. A motor driver you left enabled stays enabled. Interrupts you cared about in Part 8 do not fire on schedule.
Use the debugger to inspect state (why is this flag true?). Do not use it to prove a control loop meets a 1 ms deadline. For timing, use Serial timestamps, a logic analyzer (a gadget that records many digital signals over time so you can see exactly when each pin changed), or an oscilloscope (which draws a voltage as a live graph).
Disable or park actuators before a debug session that might pause in the wrong place.
Debug vs Verify vs Serial
| Tool | Catches | Needs |
|---|---|---|
| Verify / compiler | Typos, missing includes, type errors | Nothing on the bench |
| Serial Monitor | Runtime values you chose to print | USB-serial, baud match |
| Live debugger | Pause, inspect, step | Probe-capable board |
Start with Verify. Then Serial. Then the debugger if the board has it and prints are not enough.
Serial and debugger together
On boards that support live debug, you can still use Serial. People do: breakpoint to catch a rare state, prints for the 10,000 boring loops before it. Do not assume Monitor stays connected during a debug attach. If Monitor goes silent when debug starts, that is the probe session owning the chip, not a failed Serial.begin.
If you only need to know whether setup() ran, a boot banner in Monitor is faster than configuring a probe. Reach for the debugger when the value you need is painful to print: a struct (a bundle of several related variables), a pointer (a variable that holds the memory address of another variable), or something inside a library you cannot edit.
Troubleshooting
| Symptom | Likely cause | Fix |
|---|---|---|
| Debug button does nothing useful | Uno / no probe | Use Serial. Or get a SAMD/Zero-class board or an external probe |
| Cannot attach | Wrong probe selected, wiring, drivers | Match Tools debug probe to hardware. Vendor probe drivers |
| Hit breakpoint, sketch "broken" after Continue | Timing / interrupts / motors | Expect that. Park hardware. Do not debug delay-sensitive code as if time were real |
| Debug build will not compile | Library or optimization issue | Try a smaller sketch. Read the debug build error, not only the UI |
Wrap-up
IDE 2's debugger pauses a chip that supports a debug probe. Classic Unos do not do that over the USB-serial cable you already own. For those boards, Serial Monitor and Part 7 are debugging. When you do have a Zero-class or probed board, use breakpoints to inspect state, and do not trust paused time as proof of real-time behavior.
Hack The World and Make Awesome.