
Serial Plotter is Serial Monitor's cousin for numbers you would rather see as a line than as a stack of text. A potentiometer, a temperature, a filter settling: the graph tells you "it rings" or "it is stuck" faster than println.
Part 3 is Serial in the sketch. The DHT22 article is a real sensor you can plot later. This page is the Plotter window and the text format it expects. You can learn that format with fake data and no hardware beyond the board.
What Plotter reads
Plotter opens the same USB-serial port, at a baud rate you set, and looks for lines of numbers. A simple line is one number and a newline:
512
Several traces: numbers separated by commas or tabs, then a newline:
22.50,48.00
IDE 2 will draw one line per column. Labels in some IDE 2 versions can be sent as temp:22.5,hum:48 style prefixes. If your version ignores the words and still plots the numbers, that is fine. The numbers are the contract. If you print temp_c=22.5 with an equals sign and extra text, Plotter may not parse it. Keep Plotter lines numeric. Use Monitor when you want labels.
Match baud to Serial.begin. Garbage in Monitor is garbage in Plotter.
Monitor and Plotter both want the port. Use one at a time. If Plotter is open and Upload hangs, close Plotter.
A single-trace pot (or fake)
If you have a potentiometer on A0:
void setup() {
  Serial.begin(115200);      // Plotter must be set to the same speed
}

void loop() {
  int raw = analogRead(A0);  // 0–1023 on a classic Uno (0 V to 5 V)
  Serial.println(raw);       // One number per line = one trace
  delay(50);                 // About 20 points per second
}
Tools → Serial Plotter, 115200. Twist the pot. You want a live trace, not a flat line that never moves (wrong pin, or the pot's outer legs not connected to 5 V and GND).
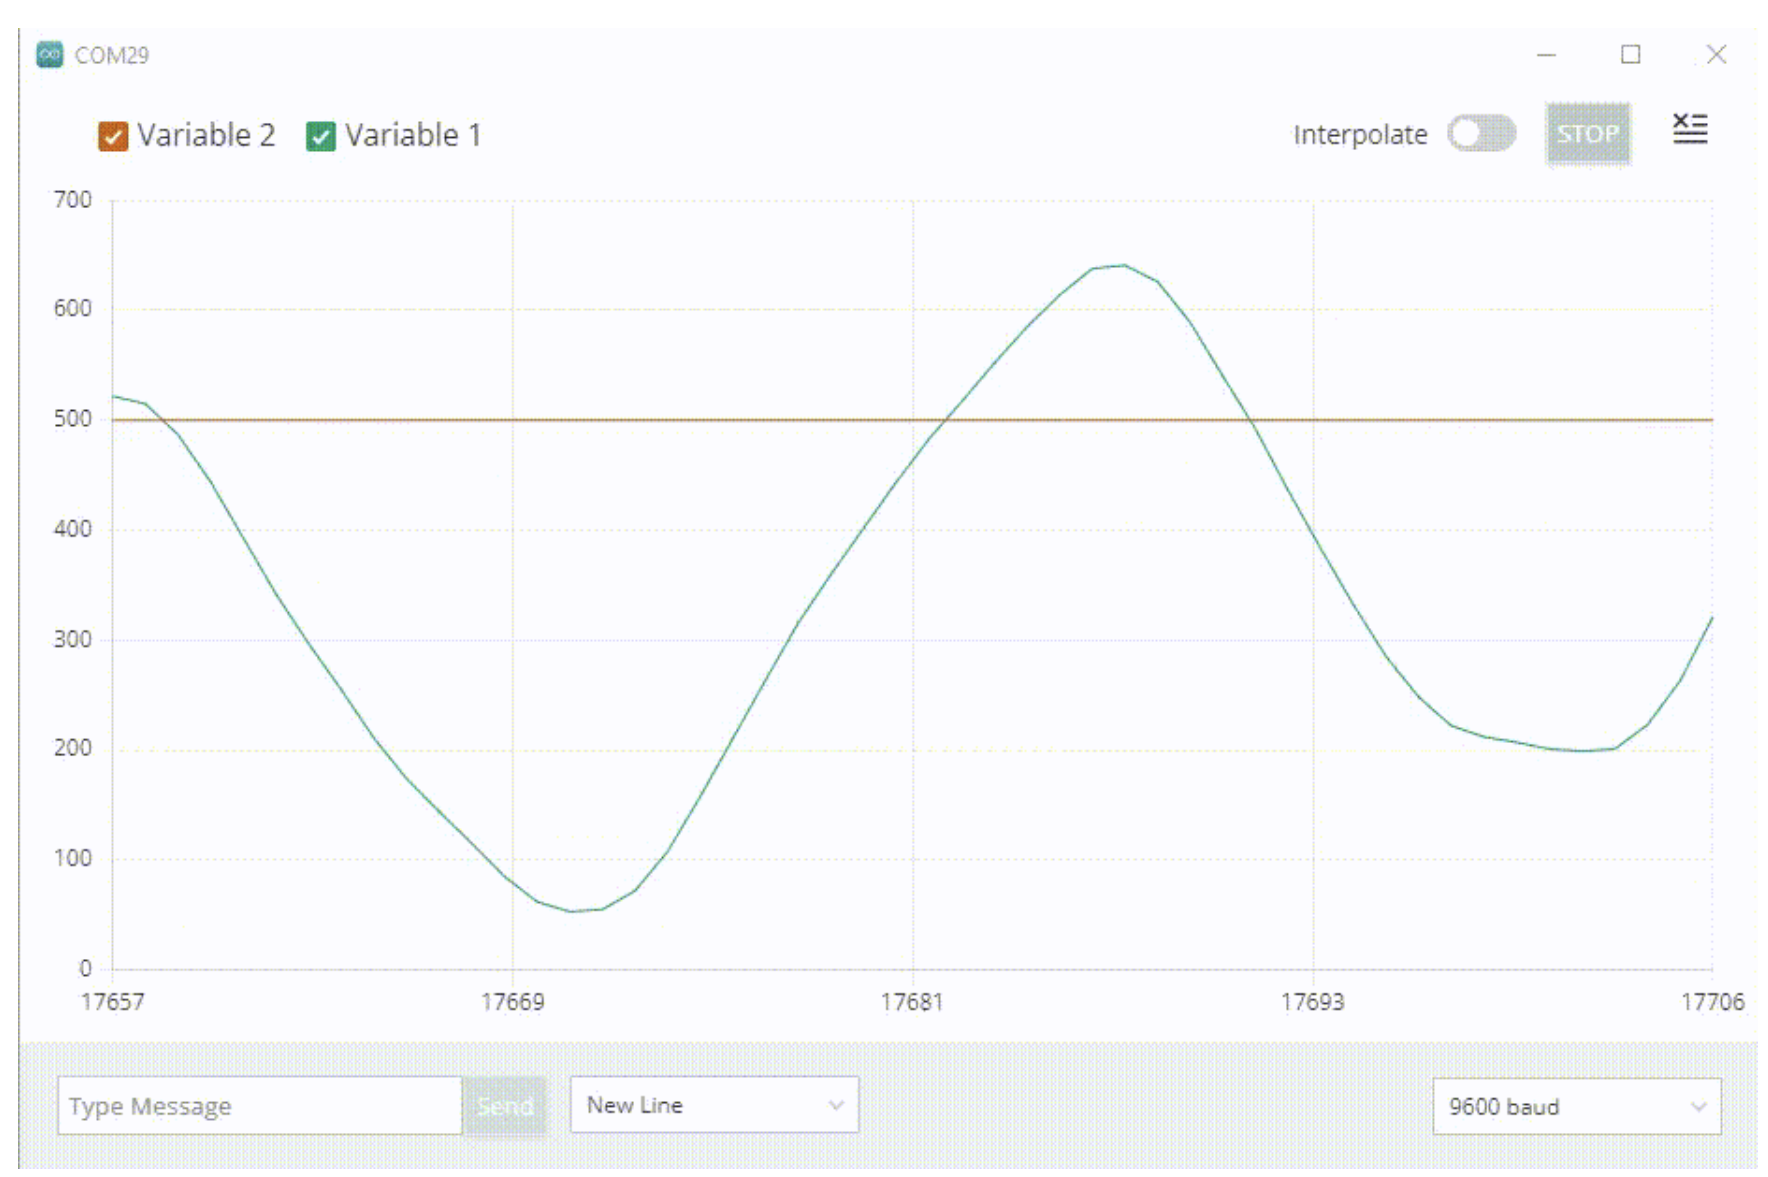
Without a pot, plot millis() or a sine:
void setup() {
  Serial.begin(115200);  // Match this in the Plotter
}

void loop() {
  // sin() swings from -1 to +1. Multiply by 400 and add 512 to swing from 112 to 912.
  int y = 512 + (int)(400.0 * sin(millis() / 500.0));
  Serial.println(y);     // One trace
  delay(40);             // 25 points per second gives a smooth wave
}
If the sine appears, Plotter works. Hardware is not the problem.
Simulated temperature and humidity
Two traces, comma-separated, no extra words:
void setup() {
  Serial.begin(115200);
}

void loop() {
  // Fake temperature drifting between 19.5 and 24.5 C
  float tempC = 22.0 + 2.5 * sin(millis() / 4000.0);
  // Fake humidity drifting between 42 and 58 %, on a different rhythm
  float hum = 50.0 + 8.0 * sin(millis() / 5500.0 + 1.0);
  Serial.print(tempC, 2);  // First column, 2 decimals, no line break
  Serial.print(',');       // Comma = "next trace"
  Serial.println(hum, 2);  // Second column, then the line break that ends the sample
  delay(100);              // Ten samples per second
}
You should see two lines, out of phase. That is the format a real DHT22 sketch should use for Plotter: Serial.print(t); Serial.print(','); Serial.println(h); and save the labeled temp_c= prints for Monitor.
When you switch to a real DHT22, keep the same two-column line. If the graph goes flat, print the same values to Monitor for one session and confirm the library returns numbers. Plotter will not tell you "checksum failed." Monitor will.
Scale, speed, and flooding
Plotter autoscales. A 0–1023 analog trace next to a 0–1.0 normalized float on the same graph will squash the float. Plot related quantities together, or multiply the small one so it is visible (and remember you scaled it).
delay(50) or millis() pacing is enough. Printing every pass of loop() with no delay can freeze the UI and the sketch.
The X axis is "samples over time," not a calibrated seconds axis unless you do extra work. For lab timing, print millis() as its own column or use timestamps in Monitor.
Three traces, and a "too big" number
Add a third column for millis() if you want a sense of time, or for a status flag (0/1) so you can see when a heater turned on:
Serial.print(tempC, 2);            // Column 1: temperature
Serial.print(',');
Serial.print(hum, 2);              // Column 2: humidity
Serial.print(',');
Serial.println(heaterOn ? 1 : 0);  // Column 3: 1 if the heater is on, 0 if off, then end the line
If heaterOn is 0 or 1 and temperature is 22, autoscaling still works. If you accidentally print raw millis() (hundreds of thousands) next to humidity (0–100), humidity becomes a flat line at the bottom. Plot millis() % 10000 if you only need a sawtooth (the % sign means "remainder after dividing," so the number climbs to 9,999 and snaps back to 0), or keep time in Monitor.
When you switch to a real DHT22
Keep Plotter lines dumb. After a successful dht.readTemperature() / readHumidity(), print the two floats and a comma. If a read fails, skip the line (do not print nan every 200 ms unless you want a broken axis). The DHT22 article on this site is the wiring and library. This article is only the two-column stream.
// isnan() = "is not a number." The DHT library returns NaN when a read fails.
if (!isnan(t) && !isnan(h)) {  // Only print when BOTH readings are good
  Serial.print(t, 2);          // Temperature
  Serial.print(',');
  Serial.println(h, 2);        // Humidity, end of line
}
Monitor for words, Plotter for shapes
Same sketch can print labeled lines for you and numeric lines for Plotter, but not on the same Serial stream without confusing Plotter. Pick one mode per session. I keep a switch at the top of the sketch. #define creates a name the compiler swaps in before compiling, and #if tells the compiler to include or skip a block of code based on it:
#define PLOT 1   // 1 = Plotter format, 0 = labeled Monitor format

// ...later, inside loop(), after reading t and h:
#if PLOT
  Serial.print(t, 2);            // Plotter wants bare numbers
  Serial.print(',');
  Serial.println(h, 2);
#else
  Serial.print(F("temp_c="));    // Monitor gets labels
  Serial.print(t, 2);
  Serial.print(F(" hum="));
  Serial.println(h, 2);
#endif
Change the 1 to a 0, upload, and open the matching window.
Troubleshooting
| Symptom | Likely cause | Fix |
|---|---|---|
| Empty graph | Baud, wrong port, prints have extra text | Match baud. Numeric lines only. Close Monitor |
| One trace when you wanted two | Missing comma, or println between values |
One line: a,b then newline |
| Upload fails | Plotter holds the port | Close Plotter |
| Wild spikes | Unconnected analog pin, or DHT read errors | An analog pin with nothing attached "floats" and reads random noise, so connect it to something (or to GND) before plotting it. Skip failed DHT reads. Do not plot -999 error codes without knowing |
Wrap-up
Serial Plotter graphs numbers on the USB-serial line. One number per line for one trace. Commas for more. Match baud. Do not mix labeled debug text into those lines. Fake a sine, then fake temperature and humidity, then point a real sensor at the same format.
Hack The World and Make Awesome.